
What Is Sales Forecasting?
Sales forecasting is the process of estimating how much revenue a company will bring in over a future period, based on its open deals and its past sales results. The output is a sales forecast, which is a figure or a range tied to a defined period, such as the next quarter.
A usable forecast also states what it measures, because the same quarter produces different numbers depending on the measure:
- Bookings are the value of contracts signed in the period.
- Recognised revenue is the income earned in the period under accounting rules. A 12-month contract signed in March is spread across those 12 months.
- Annual recurring revenue (ARR) is the yearly value of active subscriptions.
- Cash received is the money that reached your bank account in the period.
Sales teams usually forecast bookings, and finance teams convert those bookings into recognised revenue and cash.
Why Is Sales Forecasting Important?
Sales forecasting is important because a company's operating plans start from expected revenue. A shared forecast gives each team the same figure to plan against:
- Sales uses it to set quotas (the sales target for each rep or team) and to decide which deals need a manager's time.
- Finance builds spending plans and cash flow projections from it.
- Marketing compares it with the target to work out how much new pipeline to generate next quarter.
- Customer success sees how many new customers to onboard and when they will arrive.
- Supply chain teams at companies selling physical products use it to plan stock and production.
- Founders and boards use it to see how the year is tracking against the annual plan.
Who Is Responsible for Sales Forecasting?
The head of sales owns the forecast in most companies. That person is a chief revenue officer (CRO) or VP of Sales, or the founder in an early-stage business.
Several other roles feed into the number:
- Account executives (AEs), the salespeople who run deals, keep each opportunity current in the CRM and give their own call on what will close.
- Sales managers check each rep's calls against the evidence in the deal before those calls go into the team number.
- Revenue operations (RevOps) maintains the CRM data and the forecast reports. A company with no RevOps function often brings in a revenue operations consultant to set these up.
- Finance checks the sales number against signed contracts and agrees the figure that goes to the board.
How to Do Sales Forecasting
To do sales forecasting, decide what you are measuring, prepare the data behind it, apply a forecasting method and adjust the result for what has changed in the business. You then review the forecast each week as deals move.
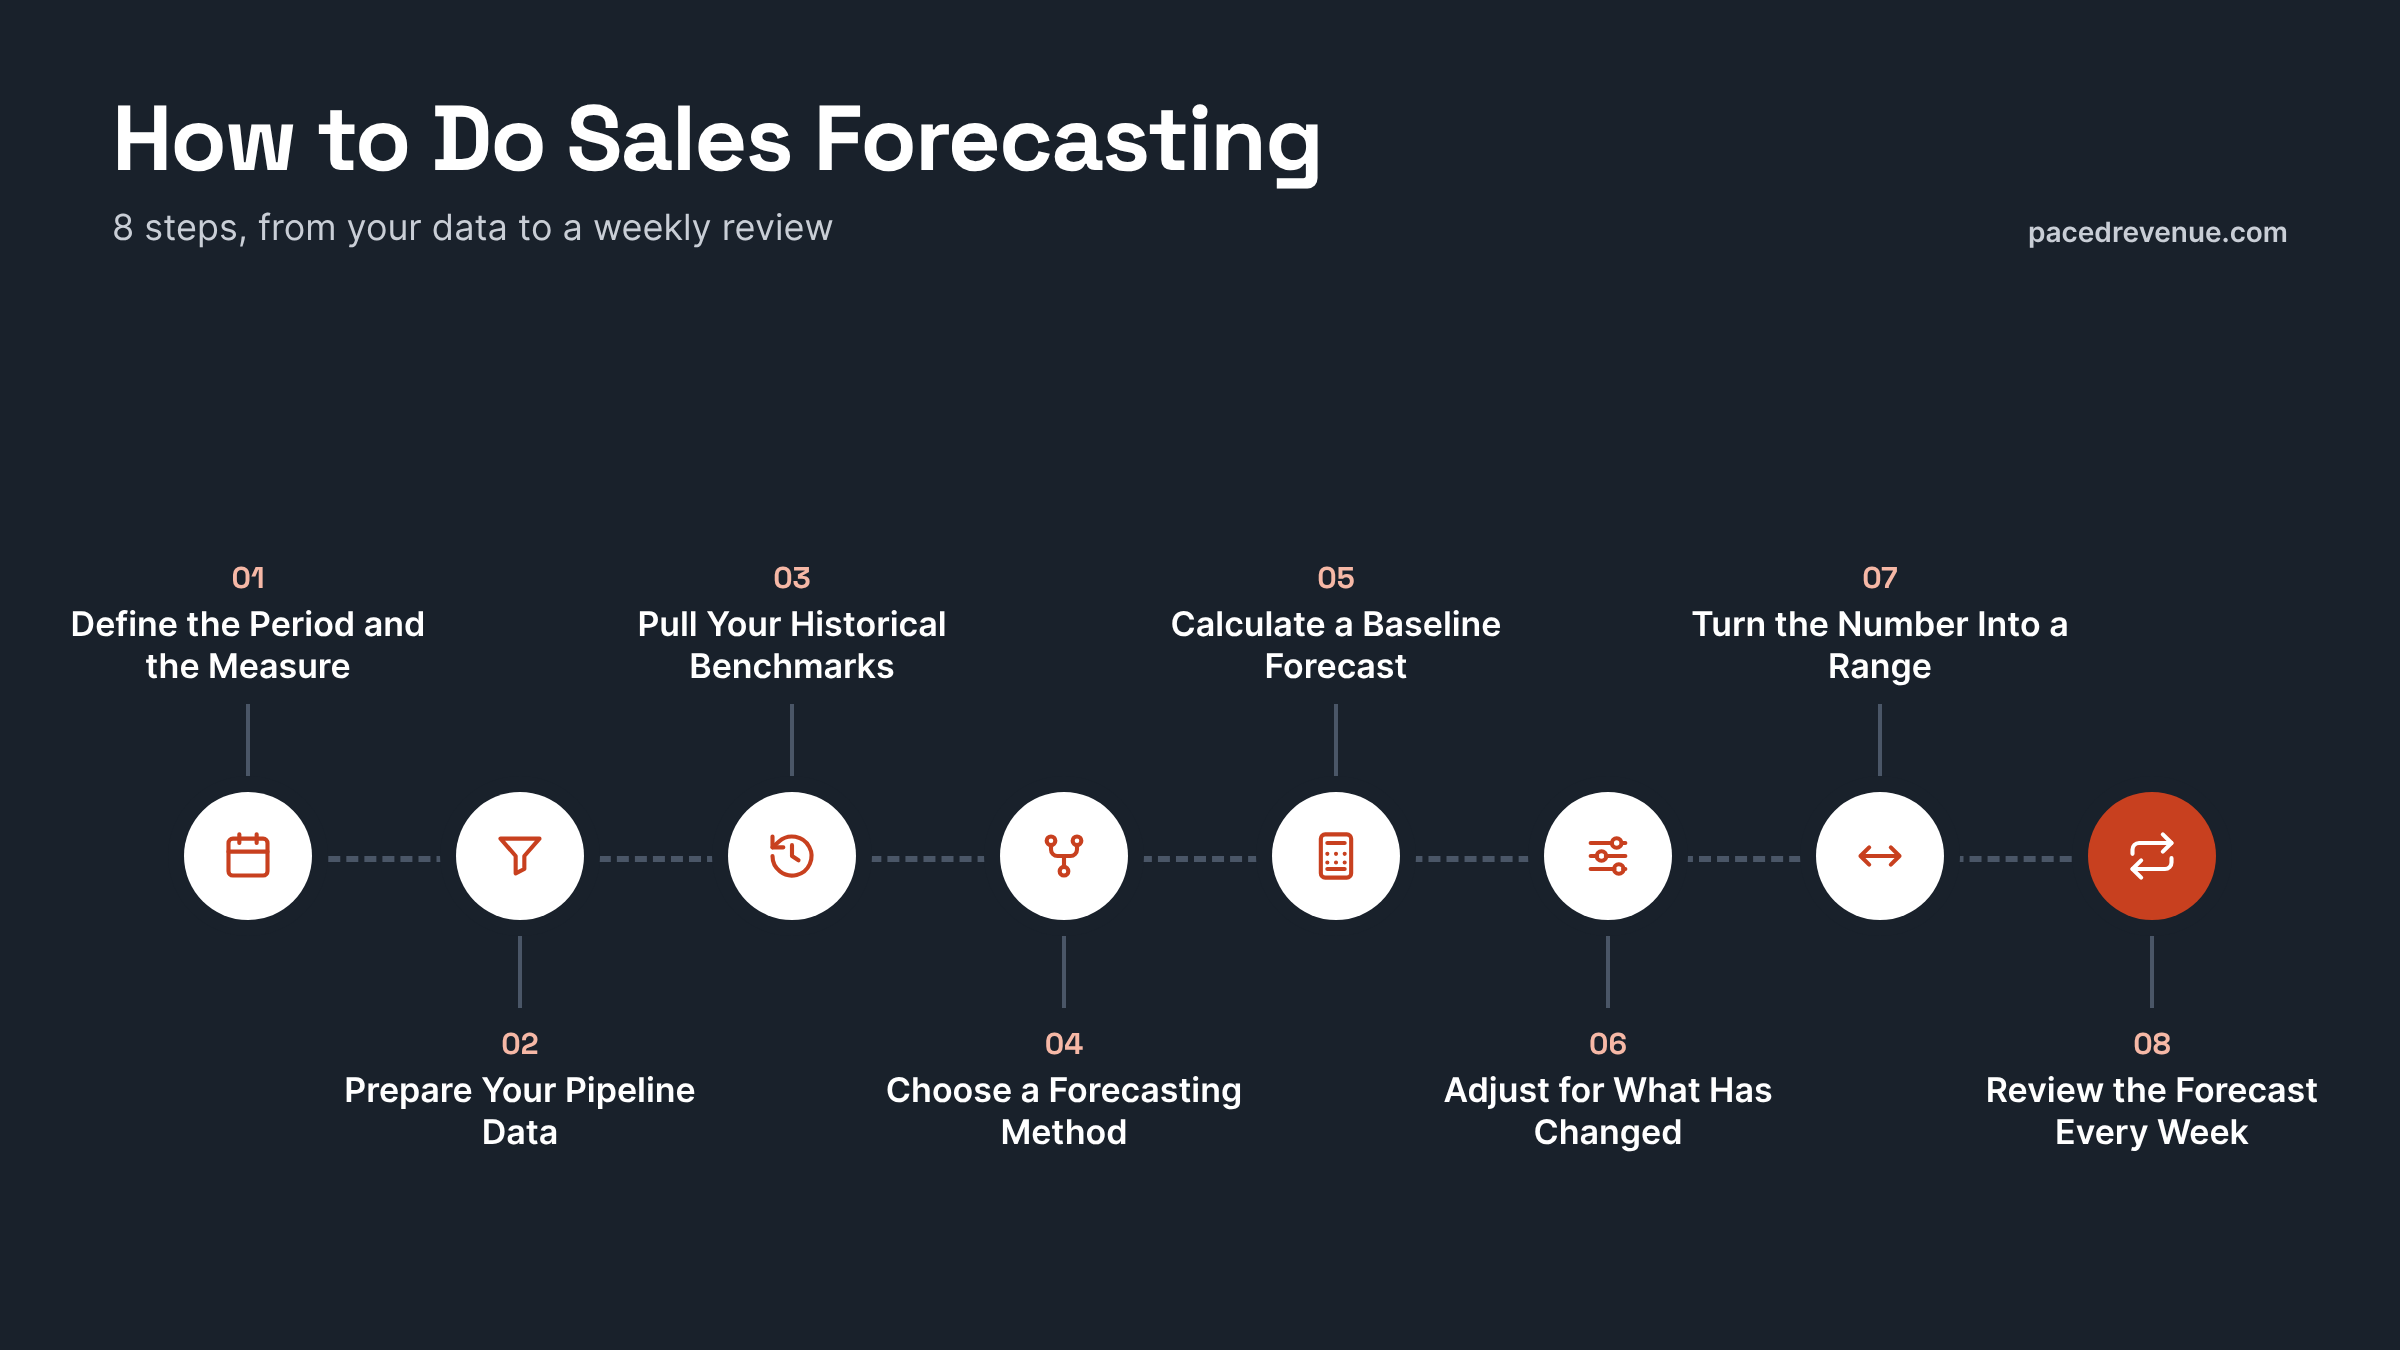
1. Define the Period and the Measure
Choose the period you are forecasting and the measure you will report, then write down which deals count towards it. Sales and finance can then read the number the same way. New business and renewals often have very different win rates (the share of opportunities won), and giving each its own line makes both easier to forecast.
2. Prepare Your Pipeline Data
A pipeline forecast reads directly from your CRM, and each open deal needs a current value, close date and stage. Stage definitions matter most here. When you set pipeline stage exit criteria based on what the buyer has done, such as confirming an evaluation timeline, a deal's stage shows how far the purchase has really moved. Regular pipeline hygiene, including closing out deals that have gone quiet, keeps those fields current between forecasts.
3. Pull Your Historical Benchmarks
Export at least a year of closed deals, which gives you a full seasonal cycle, and calculate these figures from it:
- Conversion by stage, your pipeline conversion rates from each stage through to closed won.
- Average deal size for each product or customer segment.
- Sales cycle length, the average number of days from opportunity created to deal closed.
- Seasonality, the months or quarters that regularly run above or below the average.
4. Choose a Forecasting Method
Match the method to how far ahead you are looking, which forecasters call the forecast horizon. When your sales cycle is shorter than the forecast period, most of next quarter's revenue comes from deals that are already open, and opportunity stage forecasting fits well. A forecast for the full year includes deals that don't exist yet, and it draws on historical and top-down forecasting.
5. Calculate a Baseline Forecast
Run the method on your current data with nothing adjusted. This baseline is the number the data produces before anyone adds judgement, and keeping it on record shows you later how much each adjustment changed the result.
6. Adjust for What Has Changed
Past conversion rates describe the business as it was, and this step adds what is different in the coming period. Log each adjustment with its reason. The adjustments teams make most often are:
- Pricing changes, such as a new price list or different discount terms.
- Sales capacity changes, such as a departure or a new rep who is still ramping (building up to full productivity).
- Product launches, which have no conversion history of their own.
- Campaigns and promotions, using the results of similar past activity as a guide.
- Market changes, such as a competitor's new pricing or a shift in customer demand.
7. Turn the Number Into a Range
A range gives the people planning from your forecast more to work with than a single figure. CRMs such as Salesforce and HubSpot sort open deals into commit and best case forecast categories, which provide a ready-made range. Commit holds the deals your team expects to close this period, backed by evidence such as a contract in progress. Best Case holds deals that close this period if the remaining questions are resolved.
Your low case is the revenue already closed plus every Commit deal, and your high case adds the Best Case deals on top. Within that range, you can test specific scenarios, such as your largest deal moving into the next quarter.
8. Review the Forecast Every Week
A weekly review keeps the forecast in step with what is happening in each deal. A sales pipeline review is most useful when it asks what has changed in each deal since last week and what the buyer will do next. Deals that have changed period or value are the ones to discuss first.
Sales Forecast Formula
The basic sales forecast formula multiplies the number of sales you expect by the average value of each sale.
Sales forecast = expected number of sales × average sale value
B2B teams with a pipeline of named deals use the weighted pipeline formula, which values each deal by its chance of closing.
Weighted pipeline forecast = sum of (deal value × stage probability)
A deal worth £40,000 at a stage with a 25% probability counts as £10,000. Adding up every open deal this way, then adding the revenue already closed in the period, gives the forecast for the period.
Pipeline coverage is a related calculation. It divides the open pipeline by the period's target and shows whether there is enough pipeline to reach it. The pipeline coverage ratio you need depends on your win rate, because a lower win rate takes more pipeline for each pound of target.
Sales Forecasting Techniques
The six main sales forecasting techniques are historical, opportunity stage, length of sales cycle, top-down, bottom-up and multivariable forecasting. Many teams run two of them side by side and use one to check the other.
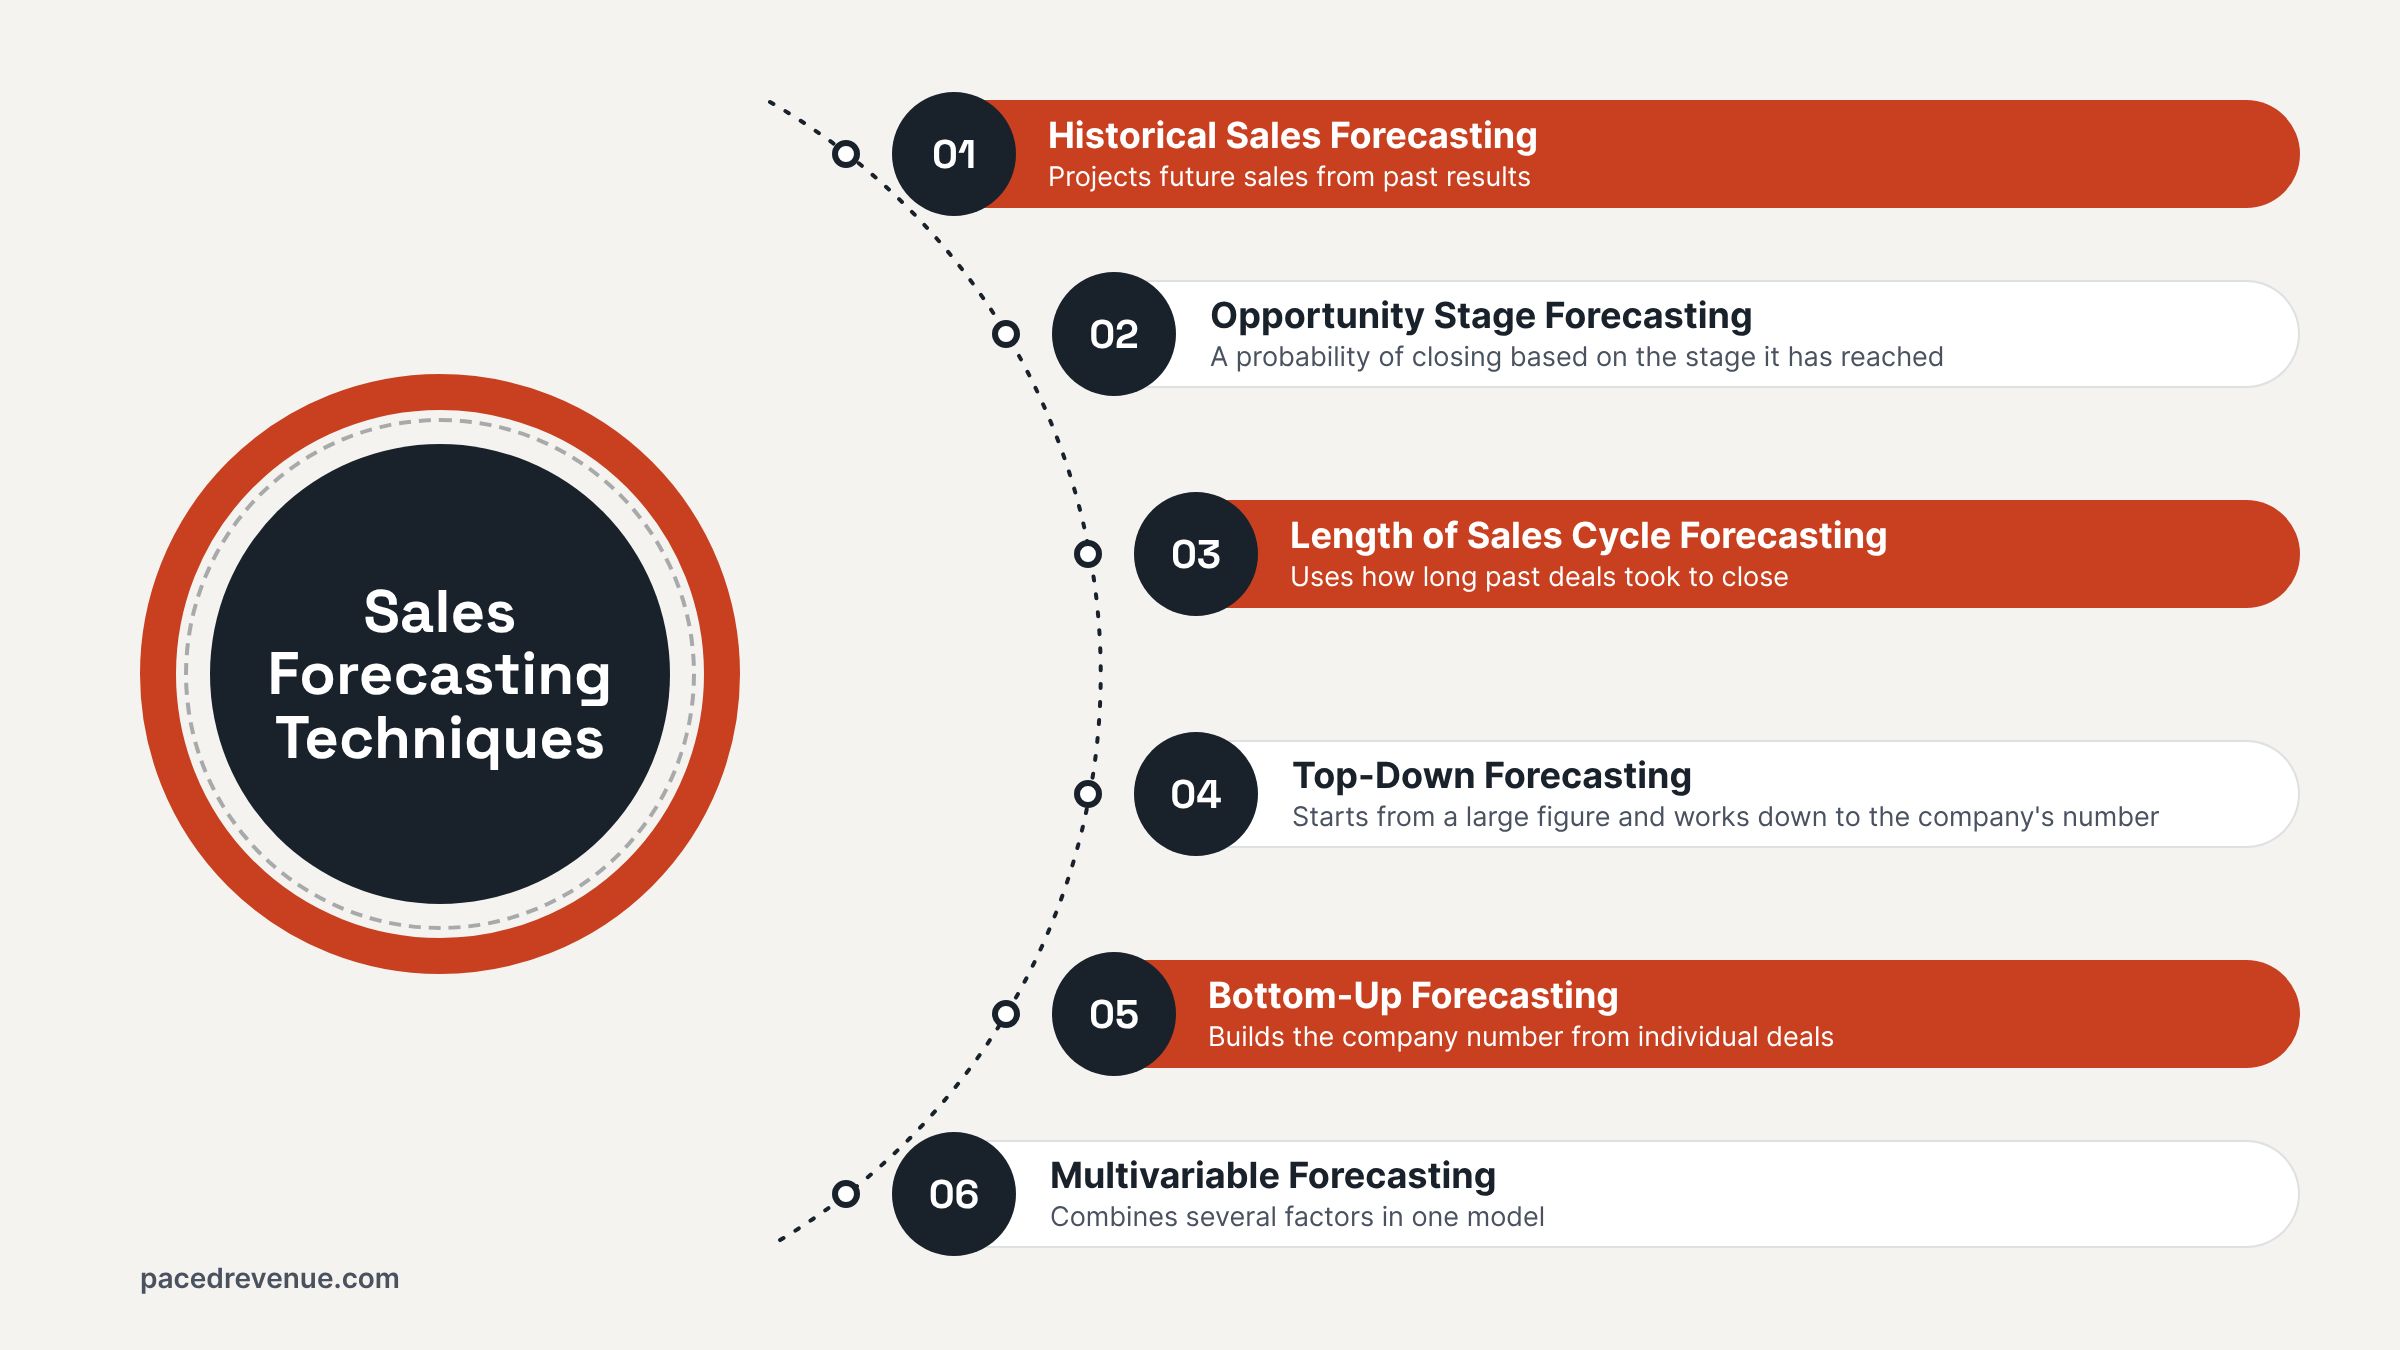
Historical Sales Forecasting
Historical sales forecasting projects future sales from past results. It takes sales from earlier periods, with the same period last year used to account for seasonality, and applies an expected growth rate along with trends in average deal size and the number of deals closed.
This technique suits businesses with steady, repeat sales and a couple of years of data. It assumes the coming period will look like the past. Because it doesn't read the current pipeline, changes such as new pricing or a larger sales team are added as separate adjustments.
Opportunity Stage Forecasting
Opportunity stage forecasting, also called pipeline forecasting, gives each open deal a probability of closing based on the stage it has reached, then applies the weighted pipeline formula. The probability for each stage is its conversion rate to closed won in your own history. Negotiation carries a much higher probability than Discovery, because far more of the deals that reach Negotiation go on to sign.
It fits B2B companies with defined pipeline stages and enough closed deals to set dependable probabilities. Every deal at the same stage receives the same probability, whatever its age or the buyer's level of activity.
Length of Sales Cycle Forecasting
Length of sales cycle forecasting uses how long past deals took to close to predict when each open deal will close, and so which period its revenue falls in. It compares how long a deal has been open with the average sales cycle for similar deals. Cycles differ by deal size and lead source, and setting an average for each segment keeps the comparison fair.
A deal that has been open far longer than its segment's average is less likely to close in the current period. This adds timing to opportunity stage forecasting, which shows a deal's chance of closing but not when it will close. The technique relies on accurate creation dates in the CRM, and a few very long deals can pull an average up.
Top-Down Forecasting
Top-down forecasting starts from a large figure and works down to the company's number. That figure is either the size of the market, with the company's expected share applied to it, or a revenue goal that leadership sets and then divides into targets for each team and rep.
It suits new markets and annual planning, where there is little pipeline or sales history to build from. The result reflects the plan and the market more than the deals in hand, and teams test it against a bottom-up forecast.
Bottom-Up Forecasting
Bottom-up forecasting builds the company number from individual deals. Each account executive calls their own deals, managers add those calls into team numbers, and the team numbers add up to the company forecast. This process is known as the forecast roll-up.
It fits established sales teams with an active pipeline, and it gives the most detailed view of the coming quarter. Its accuracy depends on how well reps call their deals, since some call high and others sandbag (hold deals back so they land in a later period). Setting the bottom-up number beside the top-down plan shows the gap between what the pipeline supports and what the business is aiming for.
Multivariable Forecasting
Multivariable forecasting combines several factors in one model to predict which deals will close and when. Typical inputs are deal stage, deal size, deal age against the average cycle, the rep's past forecasting record and buyer activity, such as meetings held and the number of people involved at the buyer's company. A regression or machine learning model weighs each factor by how strongly it predicted the outcome of past deals.
Machine learning versions of this technique are known as AI sales forecasting, and they update each deal's score as new activity comes in. The model learns from closed deals, and it suits larger sales teams with a long history of consistent CRM and activity data.
What Is Sales Forecast Accuracy?
Sales forecast accuracy is how close a forecast came to the actual result for the period it covered. It is stated as a percentage, based on the gap between the forecast and the actual result.
Accuracy is measured on the total and at deal level. The total shows whether the forecast landed near the final number, and measuring sales forecast accuracy at deal level shows whether the deals you forecast are the ones that closed.
A good forecast lands close to the actual result, and its misses don't lean in the same direction period after period. A forecast that comes in high every quarter has a pattern you can trace and correct.
Several things affect how accurate a forecast can be:
- When the forecast is made. A forecast made in the last week of a quarter draws on far more information than one made on the first day, and accuracy is compared between forecasts made at the same point in the period.
- Deal volume and size. Many small deals average out, because misses in either direction balance each other. A forecast built on a handful of large deals moves a long way when one of them changes.
- Category rules. When every rep uses the same evidence to place a deal in Commit, the categories mean the same thing across the team.
- Changes after the commit call. Discounts and contract amendments alter a deal's value after it was forecast, and recording them as they happen keeps the forecast and the contract in line.
Sales Forecasting Tools
Sales forecasting tools range from a spreadsheet to dedicated planning software, and the right choice depends on your deal volume and how many people contribute to the number.
- Spreadsheets such as Excel or Google Sheets suit small teams with a few dozen deals.
- CRM forecasting modules in Salesforce and HubSpot read directly from your deal records.
- Revenue intelligence platforms such as Clari and Gong apply multivariable forecasting to CRM and activity data.
- Planning software such as Anaplan and Xactly models sales capacity and quotas.
If you'd like a senior revenue leader to run the weekly forecast call with your team, PacedRevenue's fractional CRO services include it alongside the pipeline review.